

Many individuals and businesses struggle with keeping their financial records accurate and up-to-date, particularly when it comes to reconciling their bank statements.
This can lead to confusion, errors, and even financial losses if not addressed properly. It’s essential to have a solid understanding of bank reconciliation in order to maintain the integrity of your financial records and ensure that you’re making informed decisions based on accurate information.
In this paragraph, we will explore the step-by-step process of how to do bank reconciliation, providing you with valuable insights and practical tips to streamline this important financial task. By following these guidelines, you’ll be able to reconcile your bank statements efficiently and effectively, giving you peace of mind and a clearer picture of your financial health.
1. Your ecommerce income statement is essential for understanding whether your business is making money. It tracks revenues and expenses over a specific period, helping you gauge financial performance and plan strategically.
2. E-commerce sellers benefit from seeing detailed line items like platform fees, shipping, advertising costs, and multiple revenue streams. This breakdown helps identify what’s driving profits and where cost-saving opportunities exist.
3. The insights from your income statement help with pricing, forecasting, cash flow management, and running sales promotions. It’s also a critical tool for managing seasonal fluctuations and growth planning.
4. A clear, accurate income statement boosts credibility with lenders and investors, ensures tax compliance, and allows you to benchmark your performance against competitors using key financial metrics.
Why Is Bank Reconciliation Crucial for Businesses?
Are you struggling to make sense of your ecommerce income statement in December? You are not alone. Understanding the ins and outs of an income statement can be a challenge, especially when you are dealing with the complexities of ecommerce. In this comprehensive guide, we will break down everything you need to know about reading an ecommerce income statement, from understanding the basics to analyzing your numbers and making informed decisions. We will discuss the importance of an income statement for sellers, how to break down the components of an income statement, and how to analyze the data to improve your business’s profitability. Additionally, we will provide helpful tips on creating a good ecommerce income statement and explain how it is related to other financial statements like balance sheets and cash flow statements. By the end of this post, you will have all the tools you need to confidently navigate your own ecommerce income statement.
Importance of Income Statement
The income statement is a critical financial document for e-commerce sellers just as it is for traditional businesses. It serves multiple functions that can be particularly useful for monitoring the financial health of an online retail operation. Here are some reasons why an e-commerce income statement is important:
Financial Health and Profitability
The income statement shows whether your e-commerce business is profitable over a specific period. Knowing your net income helps you gauge the health of your business, making it easier to attract investors or secure loans.
Detailed Expense Tracking
For e-commerce sellers, understanding the complete list of expenses is crucial. This includes not just the cost of goods sold (COGS), but also fees for online platforms, shipping costs, digital advertising, and more. These details help you identify areas for cost-saving and efficiency.
Revenue Streams
E-commerce businesses often have multiple revenue streams, such as sales from different platforms, subscription fees, or digital products. An income statement helps you break down these different sources, enabling you to see which are most profitable and deserving of more focus.
Strategic Planning
The data from an income statement can be used to forecast future revenue, plan for expansions, or even decide when to run promotions and sales. Understanding seasonal fluctuations in income and expenses can also be crucial for inventory planning and cash flow management.
Investor and Lender Relations
If you are seeking external funding, investors and lenders will likely want to see your income statement to assess the risk associated with your business. A strong income statement can be a compelling tool for negotiations.
Pricing Strategies
Knowing your gross margin, which can be gleaned from the income statement, can help you set appropriate pricing strategies. This ensures you cover all costs and attain the profit margins needed for sustainability and growth.
Tax Compliance
An accurate income statement is essential for tax reporting purposes. Knowing your pre-tax and net income helps in filing accurate tax returns, which can avoid potential legal issues down the line.
Performance Metrics and KPIs
Income statements allow e-commerce businesses to derive several performance metrics, such as gross margin percentage, operating margin, and net profit margin. These metrics serve as KPIs (Key Performance Indicators) that can be tracked over time for performance evaluation.
Competitive Analysis
Understanding your own income statement can also help you compare your business’s financial health and operational efficiency against competitors in the e-commerce market.
Decision-making
Decisions around inventory management, marketing spends, hiring, and other operational aspects can be better informed when backed by solid financial data from the income statement.
Breaking Down the Ecommerce Income Statement
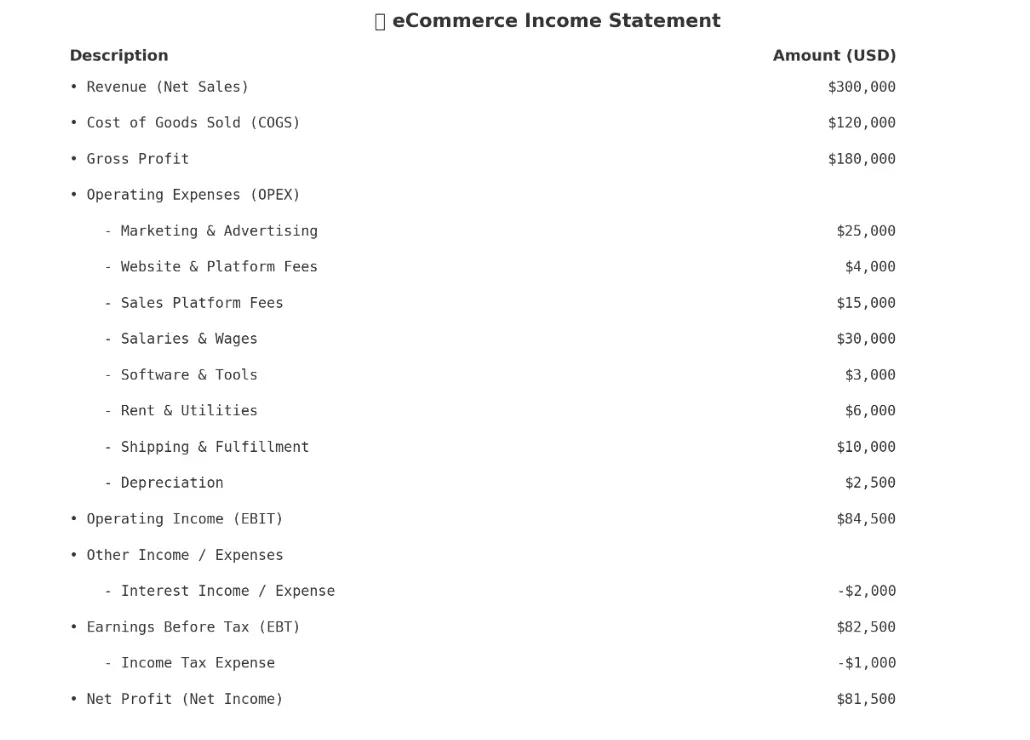
The ecommerce income statement provides a detailed breakdown of an ecommerce business’s financial performance, including revenues, expenses, and net profit or loss. It follows a specific format with various line items and is prepared for a specific time period
Here’s a breakdown of all the major components:
Sales Revenue - The Top Line
Definition: This is the total amount of money generated by the e-commerce business from selling goods and services. It’s often the top line of the income statement and does not account for any deductions.
Example: If you sold 1000 units of a product at $50 per unit, your revenue would be $50,000.
Importance: Revenue is the starting point for all other calculations. It tells you the overall size of the pie before you subtract costs and expenses.
Cost of Goods Sold (COGS) - Direct Costs
Definition: This is the direct cost of producing or acquiring the goods sold during the period. For e-commerce, this might include manufacturing costs, shipping costs, and any direct labor costs.
Example: If it costs $20 to acquire each unit (including manufacturing and shipping), then the COGS for 1000 units would be $20,000.
Importance: COGS helps you understand your gross margin and is essential for pricing strategies.
Gross Profit - What's Left After Direct Costs?
Definition: This is obtained by subtracting COGS from Revenue.
Formula: Gross Profit = Revenue – COGS
Example: In our scenario, Gross Profit would be $50,000 (Revenue) – $20,000 (COGS) = $30,000.
Importance: Gross Profit shows the basic profitability of your core business activities before administrative costs and other expenses are considered.
Operating Expenses - The Costs to Run your Business
Definition: These are the costs that are not directly tied to the production of goods but are necessary for running the business. They can include things like marketing expenses, salaries, rent, utilities, software subscriptions, etc.
Example: Let’s say you have $10,000 in operating expenses for the period.
Importance: Operating expenses help to understand the efficiency of the business operation and influence the operating profit or loss.
Operating Earnings OR EBIT (Earnings Before Interest and Taxes)- Profit from Core Operations
Definition: This is the income left after all operating expenses are subtracted from Gross Profit.
Formula: EBIT = Gross Profit – Operating Expenses
Example: $30,000 (Gross Profit) – $10,000 (Operating Expenses) = $20,000 (EBIT).
Importance: EBIT gives a clear picture of the business’s earning capability from operational activities, disregarding tax and capital structure.
EBITDA (Earnings Before Interest, Taxes, Depreciation, and Amortization)
Definition: This is a measure that adds back Depreciation and Amortization expenses to EBIT.
Formula: EBITDA = EBIT + Depreciation + Amortization
Example: If Depreciation and Amortization are $2,000, then EBITDA would be $20,000 (EBIT) + $2,000 = $22,000.
Importance: EBITDA can offer a cleaner view of the operational health of a company by removing the effects of accounting decisions related to depreciation, amortization, and interest.
Earnings Before Tax (EBT) - Pre-tax Profit
Definition: This is what remains after all expenses, including interest, have been subtracted from the EBIT.
Formula: EBT = EBIT – Interest Expenses
Example: If you have $1,000 in interest expenses, then EBT would be $20,000 (EBIT) – $1,000 = $19,000.
Importance: EBT provides insight into the company’s profitability with all operating and interest expenses accounted for but before taxation.
Net Income - The Bottom Line
Definition: This is the amount of income that remains after all expenses, taxes, and costs have been deducted.
Formula: Net Profit = EBT – Taxes
Example: If your tax is $3,800, Net Profit would be $19,000 (EBT) – $3,800 = $15,200.
Importance: Also known as “the bottom line,” Net Profit is the ultimate measure of profitability for the period under consideration. It shows what the company has earned or lost during a particular time frame.
Notes to the financial statements
Notes to the financial statements provide additional information and explanations about the numbers presented in the income statement. These notes help clarify accounting policies, assumptions, and specific transactions that may impact the financial results. Understanding the notes to the financial statements is essential for accurately interpreting the income statement. Notes provide important context and details that enhance the transparency and reliability of the financial information. Analyzing the notes can uncover significant insights and potential risks associated with the company’s financial performance. Closely reviewing the notes to the financial statements, prepared by an accountant, is crucial for gaining a comprehensive understanding of the financial data.
Difference Between Accrual and Cash Basis Income Statement Structure
In an accrual basis income statement, several items and categories might appear that are typically not visible in a cash basis income statement. Here are some of the key differences:
| Aspect | Accrual Basis | Cash Basis |
|---|---|---|
| 1.Accounts Receivable | Records revenue when a sale is made, even if the cash has not yet been received, as accounts receivable. | No accounts receivable, as revenue is only recorded when cash is received. |
| 2.Accounts Payable | Records expenses when they are incurred, not when they are paid, and shows them as accounts payable. | No accounts payable, as expenses are only recorded when paid. |
| 3.Accrued Expenses | Records any expenses that have been incurred but not yet paid. This can include wages payable, interest payable, etc. | Does not record accrued expenses since it only recognizes expenses when they are paid. |
| 4.Deferred Revenue (Unearned Revenue) | Records deferred or unearned revenue when payment is received in advance but the goods or services have not yet been delivered. | Such revenue would be recorded immediately upon receipt of cash |
| 5.Depreciation and Amortization | Allocates the cost of long-term assets over their useful lives as depreciation (for tangible assets) or amortization (for intangible assets). | No depreciation or amortization, as the full cost of assets is recorded when paid. |
| 6.Prepaid Expenses | Records prepaid expenses as an asset and allocates the cost over the period the expense relates to. | Records the entire expense at the time of payment, regardless of when the expense is actually incurred. |
| 7.Accrued Revenues | Records revenues that have been earned but for which payment has not yet been received. | Does not include accrued revenues, as income is only recorded when payment is received. |
| 8.Bad Debt Expense | If a customer doesn't pay an invoice, the expense of the bad debt is recognized. | No need to recognize bad debts since revenue is only recorded when cash is received. |
The accrual basis provides a more comprehensive view of a company’s financial position by recognizing economic events regardless of when the cash transaction occurs. This is in contrast to the cash basis, which is simpler but might not offer a fully accurate picture of a company’s financial health since it only reflects transactions when cash changes hands.
Analyzing Your Ecommerce Income Statement - Making Sense of the Numbers
Analyzing the income statement is crucial for understanding the financial performance of an ecommerce business. It helps identify revenue trends, cost drivers, and areas for improvement. Key metrics such as gross profit margin, operating margin, and net profit margin can be derived from the income statement. Comparing the income statement with industry benchmarks helps assess the company’s competitiveness and profitability. Analyzing the income statement provides valuable insights for making informed business decisions.
Analyzing an income statement involves several methods and techniques that help stakeholders understand a company’s profitability, operational efficiency, and financial stability. Here are some key methods of analysis:
1. Horizontal Analysis:
Description: This involves evaluating financial data over a series of reporting periods to identify trends.
How to Use: Calculate the percentage change in each item of the income statement compared to a base year.
Example: If revenue was $100,000 last year and is $120,000 this year, the growth rate is 20%. A continuous growth rate could indicate a strong market position.
Questions to be Asked:
- How consistent is the revenue growth year-over-year? Is the growth rate accelerating or decelerating?
- Are expenses increasing at the same rate as revenue, or is there a disparity?
- What is the trend for the net income? Is it becoming more profitable or less profitable over time?
2. Vertical Analysis:
Description: This evaluates each item on the income statement as a percentage of a base item, often revenue.
How to Use: Divide each income statement line by total revenue and multiply by 100 to get percentages.
Example: If COGS is $40,000 and revenue is $100,000, then COGS is 40% of revenue. A decrease in this percentage over time may indicate improved production efficiency.
Questions to be Asked:
- What percentage of revenue is consumed by Cost of Goods Sold (COGS), and is this percentage increasing or decreasing?
- How do operating expenses compare to overall revenue?
- Is the portion of net income relative to sales increasing or decreasing over time?
3. Ratio Analysis:
Description: This involves using ratios to assess the company’s financial health, such as profit margin, return on assets, or debt-to-equity ratios.
How to Use: Calculate ratios using income statement figures in conjunction with balance sheet numbers.
Example: To find the net profit margin, divide the net profit by total revenue. A higher margin could signify better cost control and profitability.
Questions to be Asked:
- What is the trend in the net profit margin? Is the company becoming more efficient at generating profits?
- How does the return on assets compare with industry standards or previous periods?
- Is the debt-to-equity ratio rising, and what does that imply about the company’s risk profile?
4. Benchmarking:
Description: This compares the company’s income statement figures to industry averages or to key competitors.
How to Use: Obtain industry data, either through public records or industry reports, and compare your income statement metrics.
Example: If the industry average net profit margin is 10% and your company’s is 15%, you are performing above the industry standard.
Questions to be Asked:
- How does the company’s revenue growth rate compare to competitors or the industry average?
- Are the company’s expenses in line with industry norms?
- Is the company’s profit margin above or below the industry average, and what could explain this?
5. Common-Size Analysis:
Description: This standardizes the income statement by reporting each line item as a percentage of sales, making it easier to compare companies of different sizes.
How to Use: Similar to vertical analysis, but can be applied across multiple companies.
Example: If Company A has COGS at 30% of revenue and Company B has it at 35%, Company A may have a more efficient production system.
Questions to be Asked:
- How do specific line items, like administrative costs or advertising expenses, compare as a percentage of revenue across different companies?
- Are there any outliers when comparing the company’s income statement percentages with those of competitors?
- Is the company investing more or less in R&D compared to peers?
6. Segment Analysis:
Description: This involves breaking down the company’s revenue streams by product line, geographic region, or business unit to analyze each one’s profitability and performance.
How to Use: Isolate income and costs for each segment and calculate profit margins for each.
Example: If revenue from the U.S. market is growing faster than from the European market, a company might decide to focus more resources on the U.S.
Questions to be Asked:
- Which product lines or geographical regions are the most and least profitable?
- Is the company too dependent on a single product line or market for its revenue?
- Are there any underperforming segments that are dragging down overall profitability?
7. DuPont Analysis:
Description: This is a more advanced form of ratio analysis that breaks down Return on Equity (ROE) into several components.
How to Use: Use the DuPont formula to decompose ROE into asset turnover, profit margin, and financial leverage.
Example: A low ROE could be due to low asset turnover, low profit margins, or high leverage, and DuPont analysis can help pinpoint the issue.
Questions to be Asked:
- Is low Return on Equity (ROE) due to asset management, operational inefficiency, or financial leverage?
- What components of the DuPont analysis have the most significant impact on ROE?
- How do changes in the DuPont analysis components correlate with strategic changes in the business?
By using these methods individually or in conjunction, stakeholders can gain a comprehensive understanding of a company’s financial health and make more informed decisions.
How do I know if my income statement is correct with back-of-paper math
Using quick, “back-of-the-envelope” calculations and mental estimations can give you a rough sense of whether the figures on your income statement seem reasonable. This approach can be especially useful for a quick review when you don’t have the time or resources for a more detailed analysis. Here are some ways to do it:
Revenues vs. Units Sold
If you know approximately how many units of a product or service you’ve sold and the average selling price, you can quickly estimate expected revenues.
Example: If you sold about 100 units at around $50 each, you should expect revenues to be approximately $5,000.
Gross Profit Margin
If you know your typical gross profit margin, you can estimate what your gross profit should be based on your revenues.
Example: If revenues are $10,000 and you usually maintain a gross profit margin of around 40%, then a gross profit of about $4,000 would be expected.
Operating Expenses
You likely have a sense of your fixed costs (e.g., rent, salaries) and variable costs (e.g., utilities). Adding these up should give you a rough idea of your operating expenses for the period.
Example: If rent is $1,000, salaries are $2,000, and other costs are around $500, you’d expect total operating expenses to be around $3,500.
Net Income
Knowing your revenues and expenses, you can perform a quick calculation to estimate net income.
Example: If estimated revenues are $10,000 and total expenses (cost of goods sold plus operating expenses) are about $7,500, you’d expect a net income of approximately $2,500.
Tax Expense
If you have a good idea of your effective tax rate, you can estimate your tax expenses for the period.
Example: If your net income is about $2,500 and your effective tax rate is approximately 20%, your estimated tax would be around $500.
Earnings Before Interest and Tax (EBIT)
If you know your operating expenses and gross profit, a quick subtraction should provide a reasonable EBIT figure.
Example: If your gross profit is $4,000 and operating expenses are $3,500, you’d expect EBIT to be $500.
Earnings Before Interest, Taxes, Depreciation, and Amortization (EBITDA)
If you have figures for EBIT and you know your depreciation and amortization expenses, you can estimate EBITDA.
Example: If EBIT is $500 and depreciation and amortization are $200, then EBITDA should be about $700.
Quick Ratios
Simple ratios like net profit margin (Net Income / Revenue) can be calculated quickly to check if they align with industry norms or your historical figures.
By comparing your mental estimations or quick calculations with the figures on your income statement, you can get a sense of whether the statement seems accurate. Keep in mind that this is a rough check and not a substitute for a detailed financial analysis or professional auditing.
How Income Statement is related to Other Financial Statements
The income statement is closely related to other major financial statements, namely the balance sheet and the cash flow statement. Understanding how these financial statements interact can provide a comprehensive view of a company’s financial health. Here’s how the income statement is related to these other statements:
1. Balance Sheet
Relation with Assets: – The income generated from selling goods or providing services (reported in the income statement) may increase the company’s Cash and Cash Equivalents on the balance sheet.
Relation with Liabilities: – Expenses such as Accounts Payable or Interest Payable, which are recorded on the income statement, are also reflected as liabilities on the balance sheet until they are paid.
Relation with Equity: – Net Income from the income statement affects the Retained Earnings in the Equity section of the balance sheet. Retained earnings increase by the amount of net income and decrease by dividends paid.
Example: If a company has a net income of $50,000, that amount will flow into the equity section of the balance sheet under retained earnings, assuming no dividends are paid. This will also increase the company’s total equity and, by extension, its total assets if the income results in more cash or other assets.
2. Cash Flow Statement
Operating Activities: – Many items from the income statement appear in the Operating Activities section of the cash flow statement. However, it’s important to note that the cash flow statement may be adjusted for non-cash items like depreciation and amortization, which also appear on the income statement.
Investing and Financing Activities: – While these sections do not directly correlate with the income statement, they are influenced by activities that may be funded by the company’s income or losses.
Example: If the income statement shows high operating expenses and low net income, this may correspond with a negative cash flow from operating activities in the cash flow statement. Alternatively, high net income in the income statement may be reflected as positive cash flow from operating activities.
Summary:
– Income Statement → Balance Sheet: Net Income flows into Retained Earnings under Equity; Expenses may create or change Liabilities; Revenues may increase Assets.
– Income Statement → Cash Flow Statement: Revenues and Expenses contribute to Cash Flow from Operating Activities; Net Income provides a starting point for the indirect method of calculating cash flows.
Understanding these relationships is crucial for analysts, investors, and business managers to get a holistic view of a company’s financial health. Each statement provides a unique angle, and together they offer a comprehensive understanding of a company’s financial activities.
What are some key metrics to look for when analyzing an e-commerce income statement?
When analyzing an ecommerce retailer’s income statement, you’ll want to focus on several key metrics that provide insights into the health, efficiency, and growth prospects of the business. Here are some of those crucial metrics:
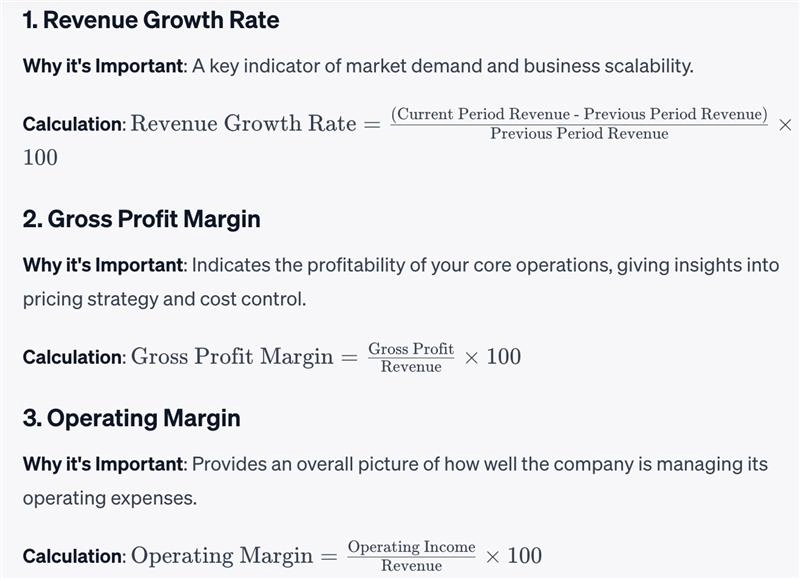
- Revenue Growth Rate
Why it’s Important: A key indicator of market demand and business scalability.
Calculation: – Revenue Growth Rate = (Current Period Revenue – Previous Period Revenue) / Previous Period Revenue) * 100
- Gross Profit Margin
Why it’s Important: Indicates the profitability of your core operations, giving insights into pricing strategy and cost control.
Calculation: – Gross Profit Margin = Gross Profit/Revenue * 100
- Operating Margin
Why it’s Important: Provides an overall picture of how well the company is managing its operating expenses.
Calculation: – Operating Margin = Operating Income / Revenue * 100
- Customer Acquisition Cost (CAC)
Why it’s Important: – Tells you how much you’re spending to acquire a new customer, which can be high in ecommerce due to advertising and promotional costs.
Calculation: – CAC = Total Sales and Marketing Expenses / Number of New Customers Acquired
- Average Order Value (AOV)
Why it’s Important: – Measures the average total of every order placed over a specific time period, providing insights into customer purchasing behavior.
Calculation: – AOV = Total Revenue / Number of Orders
- Return on Advertising Spend (ROAS)
Why it’s Important: Evaluates the effectiveness of advertising campaigns by measuring the revenue generated per dollar spent.
Calculation: – ROAS = Revenue from Ad Campaign / Cost of Ad Campaign
- Net Profit Margin
Why it’s Important: Shows what percentage of revenue is left after all costs, expenses, and taxes have been deducted. It’s a key metric for overall profitability.
Calculation: – Net Profit Margin = Net Profit / Revenue * 100
Understanding and analyzing these key metrics can offer valuable insights into an ecommerce retailer’s operational efficiency, customer behavior, and overall financial health. It can help stakeholders make informed decisions about scaling, marketing strategies, and cost control.
Are there any common mistakes to avoid when interpreting an e-commerce income statement?
Certainly, when interpreting an e-commerce income statement, there are several pitfalls you should be cautious of to ensure accurate understanding and analysis:
Common Mistakes:
- Misinterpreting Revenue: Ensure that the revenue is recognized correctly. Confusing gross revenue with net revenue can lead to significant errors in analysis. Keep an eye out for discounts, returns, and allowances to get an accurate measure.
- Ignoring Sales Tax: Sales tax should not be included as revenue. If your income statement includes sales tax in the revenue figures, it will overstate your income, leading to inaccurate calculations and possible tax implications.
- Incorrect COGS Accounting: Cost of Goods Sold (COGS) should accurately reflect the costs directly associated with the goods or services sold. Neglecting to account for all direct costs can understate your COGS, which will artificially inflate your gross margin and net income.
- Overlooking Operating Expenses: Operating expenses like advertising, salaries, and utilities should be accounted for in the period they are incurred. Missing or misclassifying these can give a distorted view of operational efficiency.
- Failing to Factor in Seasonality: E-commerce businesses can be seasonal. For accurate year-over-year comparisons, it’s important to take into account any seasonality in your business model.
- Ignoring Non-Operating Items: These include one-time gains or losses that aren’t part of the regular business activities. Ignoring them can lead to a skewed perception of the business’s ongoing profitability.
- Confusing Cash Flows and Profits: Income statements are prepared on an accrual basis, which might not represent the cash flows. Just because the income statement shows a profit doesn’t mean there is sufficient cash flow, especially in a business model that carries inventory.
- Lack of Segmentation: Many e-commerce businesses have multiple income streams (e.g., sales, affiliate income, sponsored content). Blending all these into a single figure can mask under-performing or over-performing segments.
- Not Accounting for Currency Fluctuations: If you deal in multiple currencies, then it’s essential to account for any gains or losses due to currency fluctuations.
- Ignoring KPIs: Focusing solely on profitability might lead you to ignore other important key performance indicators like Customer Lifetime Value (CLV), Customer Acquisition Cost (CAC), and Average Order Value (AOV).
By being aware of these common mistakes and taking steps to avoid them, you can more accurately interpret your e-commerce income statement to make well-informed business decisions.
Frequently Asked Questions
The difference between an income statement and a balance sheet lies in their focus and purpose. While an income statement reflects a company’s revenues, expenses, and net profit or loss over a specific period, a balance sheet provides a snapshot of the company’s assets, liabilities, and equity at a specific point in time. Both statements play crucial roles in understanding a company’s financial health.
Q1. Is profit and loss the same as an income statement?
Profit and loss statement and income statement are similar but not the same. While both provide an overview of a company’s financial performance, the income statement includes additional information such as gross profit and operating profit. The purpose of both statements is to show revenue, expenses, and net income or loss over a specific period.
Q2. What is the purpose of preparing an income statement on a regular basis?
Regularly preparing an income statement allows ecommerce businesses to track their financial performance. It helps identify areas for cost-cutting and revenue growth, enabling informed decisions about the future. Additionally, investors and lenders may require an income statement to assess the financial health of the business.
Q3. What are the 3 main parts of an income statement?
The income statement consists of three main parts: revenue, expenses, and net income. Revenue represents the total amount earned from selling goods or services. Expenses include all costs incurred in running the business. Net income is the profit left over after deducting expenses from revenue.
Q4. How does depreciation impact the values in an income statement?
Depreciation, a non-cash expense, affects the values in an income statement. It represents the decrease in asset value over time. Depreciation reduces net income and taxable income. The impact varies based on the accounting method used. However, it is added back when calculating cash flow from operations.
Conclusion
To sum up, understanding and analyzing your ecommerce income statement is crucial for the success of your business. It provides valuable insights into your financial performance, helps you forecast future profitability, identify cash flow issues, and remain compliant. By breaking down the different components of the income statement and conducting vertical, horizontal, and time series analysis, you can make informed decisions to improve your gross profit and reduce operating expenses. Remember to consider the impact of non-operating items and understand the difference between accrual and cash basis income statement structures. By utilizing the information provided in your income statement, you can predict future performance and make strategic decisions to drive your ecommerce business towards success. Start analyzing your income statement today and download our free income statement template to get started.