1. A strong current ratio for e-commerce is typically between 1.5 and 2, ensuring liquidity.
2. A debt-to-equity ratio under 1.0 indicates healthy financial leverage in e-commerce.
3. The ideal turnover ratio should be between 4 and 6 times per year to avoid overstocking or understocking.
4. An operating profit margin above 10% indicates a profitable e-commerce business.
Whether you’re a seasoned e-commerce pro or just starting out, understanding your balance sheet is like having a financial compass at your fingertips.
It’s crucial to understand your organization’s true financial standing.
By examining your company’s assets, liabilities, and net worth, you can assess its financial performance and stability.
Let’s break down the importance of balance sheet analysis using simple words:
Financial Picture: You may think of the balance sheet as a picture of your company’s money situation at one time. It shows what the company has (stuff like money and things they own), what they owe (like money they borrowed), and what’s left for the owners.
Quick Money Check: By looking at how much money your company has right now and how much you need to pay soon, you can see if the company has enough money for their bills.
Money Owed Check: The balance sheet also tells us how much money your company owes to others. This helps us see if you borrowed too much or if you’re managing your loans well.
Asset Check: Looking at what things your company has (like buildings or cash) helps us see if you’re using your stuff wisely. Too much of one thing might mean you’re not spending smartly.
Owner’s Share: The balance sheet shows what’s left for you (owner) after paying bills. Watching how this changes helps us see if your company is getting better or if there might be problems.
Compare Game: We can look at different balance sheets to see if your business is doing better or worse over time. We can also compare with other similar businesses to know if they’re doing well in their field.
Smart Choice for Investors: People who invest money check their balance sheet to know if the company is going strong. A strong company can handle economic fluctuations better.
Loan Watch: Banks and other money lending institutions also check balance sheets. A good one makes it easier for your business to get loans at good terms.
Boss Moves: Top management and business owners of companies also use the balance sheet to make informed decisions about how to use money, grow the business, and make smart choices.
Three types of balance sheet formats
When it comes to balance sheets, there’s more than one way to slice and dice the info. Each type and format serve a different purpose. Choose the one that fits your situation best.
Here are some types you should know about:
- Classified Balance Sheet: This one organizes assets and liabilities into subcategories. Super helpful for seeing details like ‘current assets’ versus ‘long-term assets’. This lets you see the details. Like peering under the hood of a car!
- Common size balance sheet: This one shows each line item as a percentage of total assets. Great for comparing companies of different sizes. It’s like converting different measurements to a common unit.
- Comparative Balance Sheet: This sheet compares financial data over multiple periods, usually years. Useful for spotting trends. It’s like time travel for your finances!
Balance sheet formats
Further, there are two types of formats for the balance sheet:
- Account Format: Assets on the left, liabilities and equity on the right. Simple to read, great for beginners.
- Report Format: All items listed top to bottom. Super clean and often used in formal reports.
A quick look at balance sheet of an ecommerce business
As we said before, your balance sheet is a crucial financial statement that provides insights into the financial position and performance of your ecommerce business. It consists of three main components: assets, liabilities, and shareholders’ equity.
While assets include current assets, non-current assets, and fixed assets; liabilities comprise current liabilities and non-current liabilities. Further, shareholders’ equity represents the owners’ investment in the business.
Analyzing the balance sheet helps you understand the financial health and stability of your ecommerce business on a regular basis. We will explain further with the help of the balance sheet analysis example below:
Sample Balance Sheet of XYZ Ecommerce Co.
As of December 31, 2023
Balance sheet terms explained
1. Assets:
Assets are an essential component of any balance sheet, representing what the ecommerce business owns or controls. They can be further categorized into current assets, non-current assets, and fixed assets.
- a) Current Assets: Current assets play a crucial role in assessing the liquidity and short-term financial health of an ecommerce business. These assets are expected to be converted into cash within one year and include cash, accounts receivable, and inventory.
For example, cash in bank, accounts receivable from customers, and inventory for sale are all considered current assets in the ecommerce industry. By analyzing these assets on a regular basis, you get insights into your business’s cash flow. Consequently, you can make informed decisions about purchasing, sales tax, and managing inventory effectively.
- b) Non-current Assets: By non-current assets, we mean those assets that provide value for more than one year. They include long-term investments, property, plant, and equipment.
Analyzing these long-term assets on the balance sheet helps us understand the long-term financial position and investment strategies of your business. For example, non-current assets in an ecommerce business can include real estate properties, machinery, and patents.
- c) Fixed Assets: Fixed assets are a subset of non-current assets, referring to tangible assets with a useful life of more than one year. In the context of an ecommerce business, fixed assets include land, buildings, vehicles, and machinery.
Furthermore, analyzing these fixed assets provides insights into the long-term investment and operational capabilities of the business. For example, warehouses, delivery trucks, and production machinery are considered fixed assets in an ecommerce business.
Need further help with assets on the balance sheet?
Ask Gary our expert accountant!
2. Liabilities
Now, what are liabilities? Well, liabilities in your balance sheet analysis refer to the financial obligations and debts that your ecommerce business has. They can be categorized further into current liabilities and non-current liabilities.
Current liabilities are the obligations that need to be settled within a year, while non-current liabilities are the long-term debts. These liabilities are recorded on the balance sheet and represent the claims of creditors against the assets of the business.
By analyzing the liabilities, you can gain insights into the financial obligations and borrowing capacity of your ecommerce business.
- a) Current liabilities: Your current liabilities are the financial obligations that must be settled within one year. Think accounts payable, accrued expenses or short-term borrowings. Analyzing your current liabilities allows you to assess the short-term financial obligations and liquidity of your ecommerce business.
For example, this may involve examining accounts payable to suppliers, accrued expenses such as salaries and taxes, and short-term loans. Understanding your current liabilities is crucial for managing cash flow and ensuring the financial health of your business.
- b) Non-current liabilities: Non-current liabilities, such as long-term loans, bonds, and deferred tax liabilities, are financial obligations expected to be settled over a period longer than one year. By knowing what is long-term debt on your balance sheet, you can gain insight into your ecommerce business’s long-term borrowing and financial obligations.
For instance, non-current liabilities in your ecommerce business can include long-term bank loans, issued bonds, and lease obligations. Understanding and managing non-current liabilities is crucial for assessing the long-term financial health and borrowing capacity of your ecommerce business.
Need further help with liabilities on the balance sheet?
Ask Gary our expert accountant!
3. Equity
Equity represents the ownership interest of the business’s owners, including common stock, preferred stock, and retained earnings. Analyzing equity provides insights into the financial health of the business and its potential for growth.
For instance, a high level of retained earnings suggests reinvesting profits back into the business rather than distributing them to shareholders. You will notice that investors and lenders often review equity before making investment or lending decisions.
a) Investments: Investments play a significant role in an ecommerce business’s balance sheet. They can include stocks, bonds, and real estate. When ascertaining what are short term investments on your balance sheet, it is crucial to analyze the return on investment (ROI) and evaluate the associated risks.
Examples of ecommerce businesses with substantial investments on their balance sheet are Amazon and Alibaba. Maintaining financial stability in an ecommerce business requires balancing investments with other assets and liabilities. By doing so, businesses can ensure long-term growth and profitability. View Amazon Balance Sheet here.
b) Retained Earnings: Retained earnings are an essential component of an ecommerce business’s financial health. They represent the accumulated profits that have not been distributed to shareholders. You can calculate retained earnings by subtracting dividends from net income.
To know more, you can check out this blog on How to calculate retained earnings on a balance sheet.
Monitoring trends in retained earnings over time helps in financial planning and decision-making. Further, they can be utilized for investments, dividend payouts, or debt repayment, allowing businesses to strategically allocate their resources. Successful management of retained earnings is crucial for maintaining a solid foundation for the ecommerce venture.
How different accounting methods affect balance sheet structure?
It’s important to clarify that the concept of accrual and cash basis primarily affects the income statement and the cash flow statement, rather than the balance sheet structure per se. This is because the balance sheet is a snapshot of a company’s financial position at a specific point in time and includes all assets, liabilities, and equity, regardless of when cash changes hands.
However, the accounting method used can indirectly influence the balance sheet in terms of what is recorded and when.
Below are some of the differences in how balance sheets might look under each accounting method:
1. Accrual Basis
- a) Accounts Receivable: Likely to appear because revenue is recorded when earned, not necessarily when cash is received.
- b) Accounts Payable: Likely to be included because expenses are recorded when incurred, not necessarily when paid.
- c) Prepaid Expenses and Deferred Revenue: More likely to be accounted for as businesses recognize expenses and revenues over time, rather than upon payment.
- d) Accrued Liabilities: Common, including things like wages payable, interest payable, etc., because expenses are recorded as they are incurred.
2. Cash Basis
- a) Accounts Receivable: Unlikely to appear because revenue is only recorded when cash is received.
- b) Accounts Payable: Unlikely to be included because expenses are only recorded when paid.
- c) Prepaid Expenses and Deferred Revenue: Less common, as transactions are typically only recorded when cash changes hands.
- d) Accrued Liabilities: Rarely, if ever, included because the method only records transactions when cash is paid or received.
Also Read: Difference between cash basis and accrual basis of accounting.
Differences in Equity
The retained earnings section under equity might differ based on the accounting method used. Under the accrual basis, retained earnings reflect a more complex interplay of revenues earned and expenses incurred, while under the cash basis, it would largely represent the cash in-flows and out-flows.
Differences in Current and Non-Current Categorization
- Accrual Basis: Easier to distinguish between current and non-current assets or liabilities because of the recognition of receivables, payables, and other accruals.
- Cash Basis: Might be challenging to classify assets and liabilities as current or non-current due to the lack of accruals.
Balance sheet analysis methods and tips
Balance sheet analysis is essential for understanding a company’s financial position at a specific point in time. It offers valuable insights into its assets, liabilities, and equity. The primary methods for balance sheet analysis include:
- Vertical Analysis
- Horizontal Analysis
- Ratio Analysis
- Common Size Analysis
Hypothetical Balance Sheet (Figures in $ Thousands)
Let’s assume Company XYZ’s balance sheet has the following figures for two years, 2022 and 2023, to help explain these analysis methods:
2022
- Assets
Current Assets: $500
Fixed Assets: $1500
Total Assets: $2000 - Liabilities
Current Liabilities: $300
Long-term Liabilities: $700
Total Liabilities: $1000 - Equity
Shareholder’s Equity: $1000
2023
- Assets
Current Assets: $600
Fixed Assets: $1600
Total Assets: $2200 - Liabilities
Current Liabilities: $400
Long-term Liabilities: $800
Total Liabilities: $1200 - Equity
Shareholder’s Equity: $1000
Vertical Balance Sheet Analysis for 2022 and 2023
For 2022 (Figures in percentages, base = Total Assets)
- Assets
Current Assets: $500 / $2000 = 25%
Fixed Assets: $1500 / $2000 = 75%
Total Assets: $2000 / $2000 = 100% - Liabilities
Current Liabilities: $300 / $2000 = 15%
Long-term Liabilities: $700 / $2000 = 35%
Total Liabilities: $1000 / $2000 = 50% - Equity
Shareholder’s Equity: $1000 / $2000 = 50%
For 2023 (Figures in percentages, base = Total Assets)
- Assets
Current Assets: $600 / $2200 = 27.27%
Fixed Assets: $1600 / $2200 = 72.73%
Total Assets: $2200 / $2200 = 100% - Liabilities
Current Liabilities: $400 / $2200 = 18.18%
Long-term Liabilities: $800 / $2200 = 36.36%
Total Liabilities: $1200 / $2200 = 54.55% - Equity
Shareholder’s Equity: $1000 / $2200 = 45.45%
Insights from Vertical Analysis
- Assets: The proportion of Current Assets has increased from 25% to 27.27%, suggesting that the company may be holding more liquid assets compared to the previous year.
Fixed Assets have slightly decreased as a percentage of total assets from 75% to 72.73%, possibly indicating a higher focus on liquidity.
- Liabilities: The proportion of Current Liabilities increased from 15% to 18.18%, which could mean higher short-term obligations relative to total assets.
Long-term Liabilities increased from 35% to 36.36%, which might signify the company is taking on more debt compared to total assets.
- Equity: Shareholder’s Equity has reduced from 50% to 45.45% of total assets, showing that a larger proportion of assets is being financed by debt rather than equity.
The vertical analysis indicates that Company XYZ has become slightly more leveraged with a higher proportion of its assets financed by debt. It has also increased its short-term obligations relative to total assets, which could impact its liquidity. On the flip side, the company is holding a higher proportion of liquid assets, which could be a positive sign, depending on the industry standards and the company’s strategy.
Horizontal Balance Sheet Analysis
In horizontal analysis, you look at how specific items on the balance sheet have changed over time, usually as a percentage. It helps in identifying trends and making year-over-year comparisons.
Changes from 2022 to 2023
- Assets:
Current Assets: ($600 – $500) / $500 = 20% Increase
Fixed Assets: ($1600 – $1500) / $1500 = 6.67% Increase
Total Assets: ($2200 – $2000) / $2000 = 10% Increase - Liabilities:
Current Liabilities: ($400 – $300) / $300 = 33.33% Increase
Long-term Liabilities: ($800 – $700) / $700 = 14.29% Increase
Total Liabilities: ($1200 – $1000) / $1000 = 20% Increase - Equity:
Shareholder’s Equity: ($1000 – $1000) / $1000 = 0% Change
Insights from Horizontal Analysis
- Assets: Both current and fixed assets have increased, with current assets growing faster than fixed assets. This could indicate improved liquidity.
- Liabilities: Both current and long-term liabilities have increased at a rate faster than the assets. This could indicate increased financial risk.
- Equity: Shareholder’s equity remained unchanged, suggesting that the growth in assets is funded by liabilities rather than equity capital.
Ratio Analysis
Ratios are powerful tools that help assess the financial health of a company. Here are some common ratios that can be calculated using the balance sheet:
- Current Ratio: Current Assets / Current Liabilities
2022: $500 / $300 = 1.67
2023: $600 / $400 = 1.5 - Debt-to-Equity Ratio: Total Liabilities / Shareholder’s Equity
2022: $1000 / $1000 = 1
2023: $1200 / $1000 = 1.2 - Asset Turnover Ratio: Sales Revenue / Average Total Assets
(assuming Sales Revenue of $3000 for both years)
2022: $3000 / $2000 = 1.5
2023: $3000 / $2200 = 1.36
Insights from Ratio Analysis
- Current Ratio: The current ratio decreased from 1.67 to 1.5, which might indicate a slight decrease in liquidity or an increase in short-term obligations.
- Debt-to-Equity Ratio: The debt-to-equity ratio increased from 1 to 1.2, indicating that the company is using more debt to finance its assets, which increases financial risk.
- Asset Turnover Ratio: The asset turnover ratio decreased from 1.5 to 1.36, suggesting that the company is less efficient in using its assets to generate sales.
We can infer that while Company XYZ has increased its assets and liabilities, it has slightly decreased its liquidity and increased its financial risk.
Furthermore, the efficiency in utilizing assets to generate revenue has decreased. Overall, the company might need to assess its growth strategy and financing options carefully.
Confused about balance sheet analysis?
Get expert help.
Common Size Analysis for 2022 and 2023
Given that we already calculated the vertical analysis percentages for the years 2022 and 2023, we can compare those directly to do a common size analysis.
For 2022 (Base = Total Assets)
- Assets
Current Assets: 25%
Fixed Assets: 75% - Liabilities
Current Liabilities: 15%
Long-term Liabilities: 35% - Equity
Shareholder’s Equity: 50%
For 2023 (Base = Total Assets)
- Assets
Current Assets: 27.27%
Fixed Assets: 72.73% - Liabilities
Current Liabilities: 18.18%
Long-term Liabilities: 36.36% - Equity
Shareholder’s Equity: 45.45%
Insights from Common Size Analysis
- Assets: The percentage of Current Assets has slightly increased from 25% to 27.27%, suggesting a shift toward holding more liquid assets.
Conversely, Fixed Assets as a percentage of Total Assets have slightly reduced from 75% to 72.73%.
- Liabilities: Current Liabilities as a percentage of Total Assets have gone up from 15% to 18.18%, pointing to a larger weight of short-term debt in the company’s capital structure.
Similarly, Long-term Liabilities increased from 35% to 36.36%, indicating a slight uptick in the long-term obligations relative to total assets.
- Equity: The percentage of Shareholder’s Equity has dropped from 50% to 45.45%. This means the company is financing a larger portion of its assets through liabilities rather than equity, which might signify increased financial risk.
Overall, the common size analysis reveals trends in how Company XYZ is managing its assets, liabilities, and equity. The company appears to be becoming more liquid but also more leveraged, meaning it is increasingly using debt to finance assets. This could have implications for the firm’s financial stability and would require further investigation into whether these trends are industry-specific or unique to the company.
10 key metrics for ecommerce balance sheet analysis
When analyzing the balance sheet of an ecommerce company, there are several key metrics and ratios that can provide valuable insights into the financial health and operational efficiency of the business. Here are some to consider:
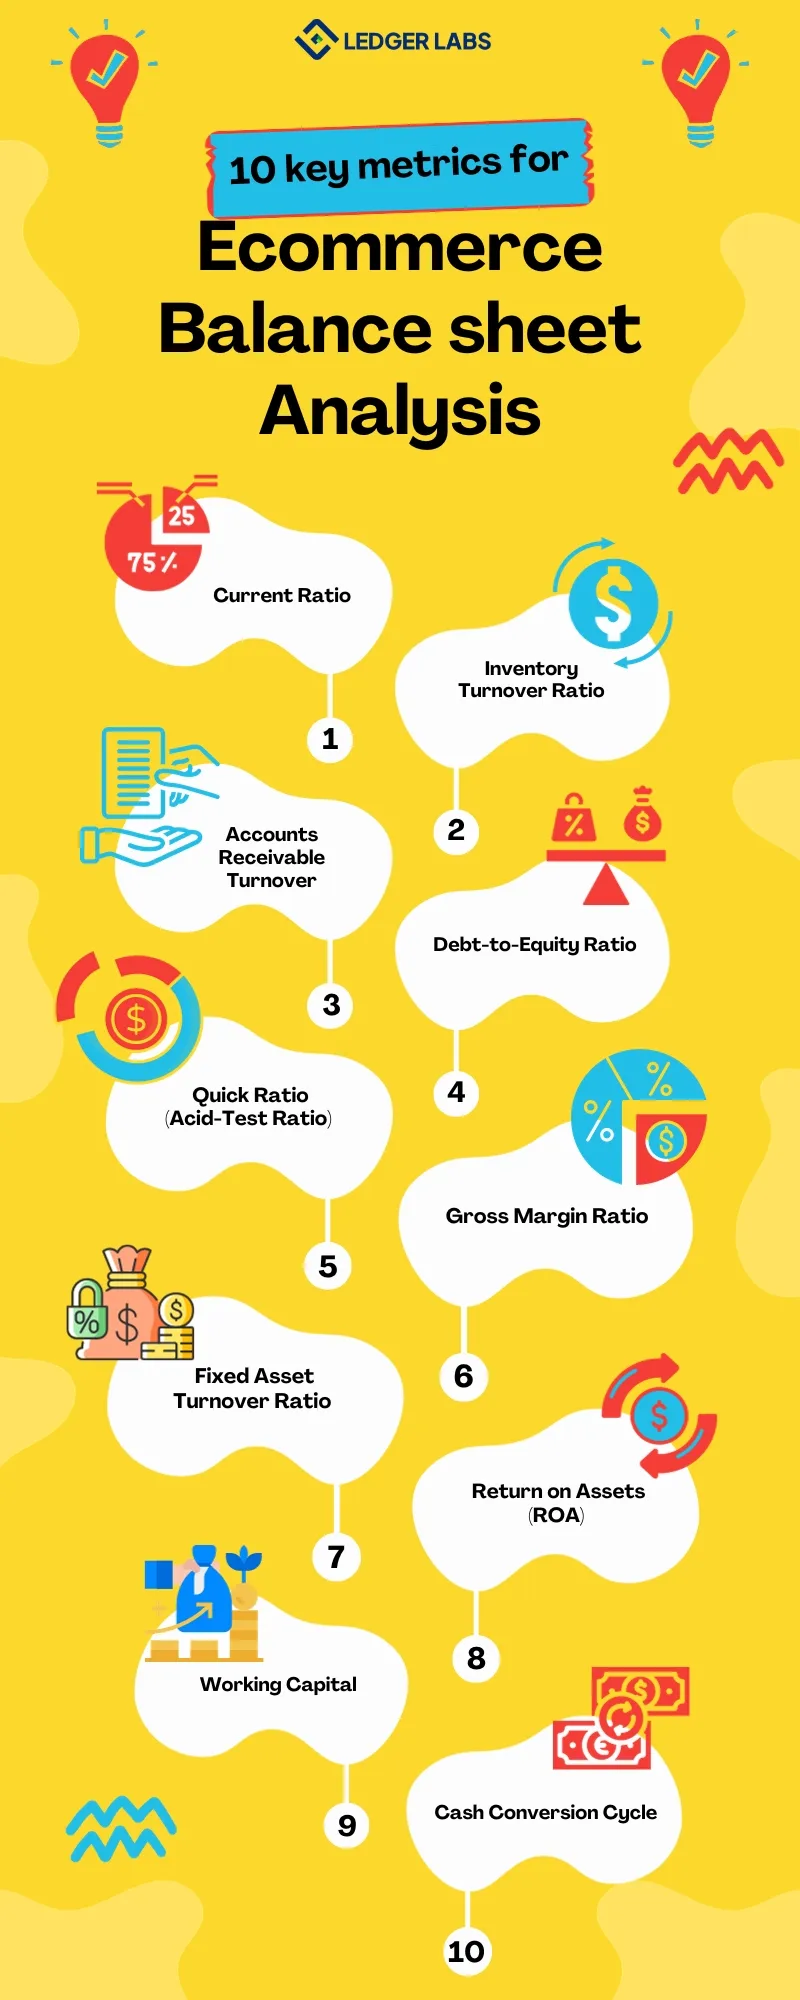
- Current Ratio
Importance: Measures liquidity by comparing current assets to current liabilities. E-commerce companies often have fast inventory turnover and may require quick payments, making liquidity crucial. - Inventory Turnover Ratio
Importance: Measures how many times a company’s inventory is sold and replaced over a period. High inventory turnover generally indicates strong sales, while low turnover could indicate poor sales and excess inventory. - Accounts Receivable Turnover
Importance: For e-commerce businesses that offer credit to customers, this metric can indicate how efficiently a company collects payment. Slow turnover might signal inefficiency or a high level of bad debt. - Debt-to-Equity Ratio
Importance: Indicates the proportion of debt used to finance the company’s assets. E-commerce businesses may rely on debt to fund growth, but a high ratio can be risky. - Quick Ratio (Acid-Test Ratio)
Importance: This ratio excludes inventory from current assets and then divides it by current liabilities, giving a more stringent measure of liquidity. It’s crucial for e-commerce businesses where inventory might not be as easily liquidated. - Gross Margin Ratio
Importance: While this is not directly found on the balance sheet, the cost of goods sold is usually linked to the inventory, an asset. This ratio shows the percentage of total sales revenue that exceeds the cost of goods sold, and it’s crucial for understanding profitability. - Fixed Asset Turnover Ratio
Importance: Measures how effectively the business is using its fixed assets (like warehouse equipment and technology) to generate sales. Low ratio might indicate underutilization. - Return on Assets (ROA)
Importance: Measures how efficiently a company uses its assets to generate profit; calculated by dividing net income by total assets. High ROA means better asset utilization. - Working Capital
Importance: The difference between current assets and current liabilities. Positive working capital is often needed for an e-commerce business to ensure it can maintain day-to-day operations. - Cash Conversion Cycle
Importance: Measures the time it takes in days from purchasing inventory to receiving cash from customer sales. A shorter cycle is generally better and indicates a more efficient operation.
How can you use the balance sheet without crunching numbers to check whether your business is making money?
Analyzing a balance sheet without crunching numbers can be challenging, but it’s not impossible. Here are some qualitative ways to gauge if your business is making money just by looking at the balance sheet:
- Asset Growth: Look at your assets from one period to the next. If assets are consistently growing, particularly current assets like cash and accounts receivable, it could be a good indicator that the business is making money.
- Liabilities Perspective: If your liabilities aren’t growing as fast as your assets or are even decreasing, that might indicate that your business is making enough money to cover its debts, which is a positive sign.
- Equity Increases: An increase in shareholder’s equity generally suggests that the business is making money, provided it’s not because of additional investment but rather due to retained earnings. Growing equity usually signifies a healthy, profitable business.
- Inventory Levels: For businesses dealing in physical goods, if inventory levels are stable or decreasing (without an associated decrease in sales), it could mean you’re turning over inventory effectively, which is often a sign of profitability.
- Debt Structure: Assess whether the company is taking on more debt to finance operations. If the debt levels are stable or decreasing, and assets are increasing, your business is likely generating positive cash flows.
- Overall Balance Sheet Health: Look for a general balance between assets, liabilities, and equity. A business that is skewed too heavily towards liabilities may be risky, while one with increasing assets and equity is generally viewed as healthier and likely making money.
While these indicators can provide a high-level view, it’s important to note that a balance sheet won’t provide a full picture of profitability. For a comprehensive understanding, it should be reviewed in conjunction with other financial statements like the income statement and cash flow statement.
Conclusion
Analyzing the balance sheet of your ecommerce business is crucial for making informed decisions and understanding the financial health of your company.
It provides you with key insights into your assets, liabilities, and equity, allowing you to manage cash flow, identify risks and opportunities, and analyze financial ratios.
By forecasting sales and cash flow, preparing financial statements, and optimizing inventory management, you can ensure the profitability and success of your business.
And if you want affordable bookkeeping and accounting for your business, you can connect with us at Ledger Labs.
FAQs
- Where does cash go on a balance sheet?
Cash is typically categorized under the “Current Assets” section of a balance sheet, alongside accounts receivable and inventory. It is crucial to monitor cash flow and maintain sufficient liquidity for smooth business operations. A balance sheet provides a snapshot of a company’s financial position at a specific point in time. - Where do you find total debt on financial statements?
Total debt can be found under the liabilities section of the balance sheet. It includes both current and long-term debt obligations. Analyzing total debt helps evaluate solvency and repayment capacity, providing insight into a business’s financial obligations and level of risk associated with borrowing activities. - Where is inventory reported in the financial statements?
Inventory is typically reported as a current asset on the balance sheet. It provides crucial insights into a company’s financial position. Ecommerce businesses must accurately track and report their inventory to effectively manage their operations and make informed business decisions. - What Insights Should You Look for in a Balance Sheet?
When analyzing a balance sheet, it’s important to look for insights into the company’s financial health and liquidity. Assess the current assets and liabilities to evaluate solvency and profitability. - Why should e-commerce vendors prepare monthly balance sheets?
Preparing monthly balance sheets is crucial for e-commerce vendors. It helps monitor financial performance, identify trends, and make informed decisions. By providing a true financial standing, it aids in forecasting and planning for future growth. - What role does inventory play on the balance sheet of an ecommerce business, and how can it be optimized?
Inventory is a crucial asset for ecommerce businesses and is reported on the balance sheet. Optimizing inventory management can enhance cash flow and profitability. Accurate valuation and tracking of inventory are essential for financial reporting. - How does debt affect the balance sheet of an ecommerce business, and what strategies can be used to manage it?
Debt plays a significant role in shaping the balance sheet of an ecommerce business. It affects the overall financial health and stability of the company. Managing debt effectively is crucial for long-term success. Strategies such as refinancing or negotiating better terms with creditors can help reduce debt burden. It’s important to analyze key financial ratios like debt-to-equity ratio and current ratio to assess the impact of debt on the business. Regularly reviewing and analyzing the balance sheet allows for informed decision-making and ensures the business remains financially stable.


